CTO’s 90-Day Legacy Modernization Assessment
Table of contents

Introduction
Your legacy system still works. It also takes 3 days to deploy a change that should take 3 hours. Onboarding a new engineer means 6 months of reading tribal knowledge buried in internal company pages nobody updates. And every integration request turns into an archaeological dig through code that predates your tenure.
You know legacy system modernization belongs on the roadmap. But the last time you raised it, the CFO asked a question you couldn’t answer with confidence: “How much is this actually costing us?”
This 90-day assessment framework gives you the answer. It replaces gut feeling with a codebase health score, a dollar figure on the cost of doing nothing, and a one-page recommendation you can hand to your board.
Why Most Legacy Modernization Projects Stall Before They Start
The failure point is almost never execution. It’s an assessment. 3 patterns repeat across industries, company sizes, and tech stacks.
The Shiny Object Trap.
A team picks the solution (“microservices!”) before scoping the actual problem. Six months in, they discover 400 undocumented database triggers. Budget gone. Morale spent.
The Scope Avalanche.
No structured assessment means every team adds their own items to the wishlist. “Replace billing” becomes “rebuild everything.” The project grows too large to fund. Nothing moves.
Political Failure.
The CTO presents the case in engineering language. The CFO hears cost. The CEO hears risk. There’s no shared vocabulary, so there’s no approval.
The root cause in every case: no structured assessment. Fix that, and you fix the conversation.
The 90-Day Legacy System Modernization Assessment Framework
3 phases. Each produces a measurable output your leadership team can act on.
Phase 1 quantifies the technical problem.
Phase 2 translates it into dollars.
Phase 3 scores your organization’s readiness to move.
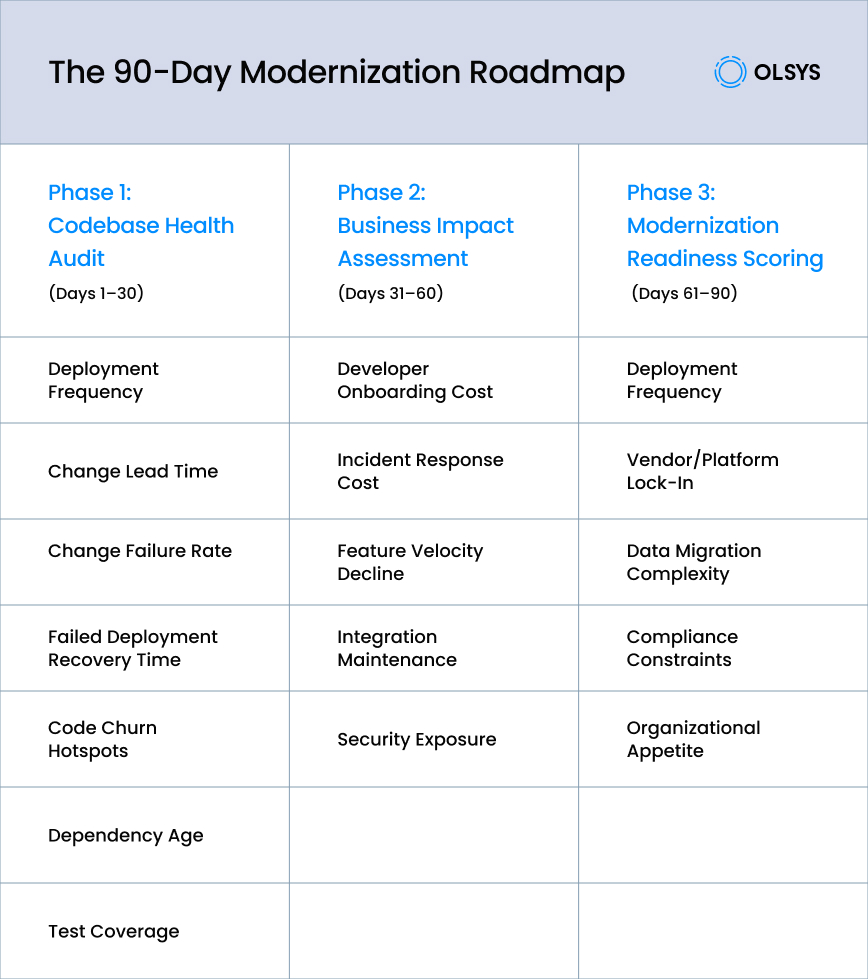
Phase 1: Codebase Health Audit (Days 1–30)
Start by measuring your codebase against industry benchmarks. The DORA metrics, published annually by Google’s DevOps Research and Assessment team, are the industry standard for software delivery performance. Here are the four to benchmark first:
Deployment Frequency.
Elite teams deploy on demand, multiple times per day. Low performers push updates monthly to every six months. Where your team falls on this spectrum tells you how much friction lives in your pipeline.
Change Lead Time.
This measures the gap from code commit to production. The 2024 DORA report shows elite teams achieve sub-day lead times, while low performers measure theirs in weeks or months.
Change Failure Rate.
The percentage of deployments causing rollbacks or hotfixes. Elite teams sit at around 5%. If your rate is above 30%, the system is telling you something about its structural health.
Failed Deployment Recovery Time.
Elite teams restore service in under an hour. If your recovery is measured in days, that’s a business continuity issue, not a technical one.
Then go deeper with 3 additional measures:
Code Churn Hotspots.
Run a git log analysis of your most frequently changed files. High churn reveals where bugs cluster. It also reveals where the highest modernization ROI lives.
Dependency Age.
Flag libraries more than two major versions behind or past end-of-life. Each outdated dependency is an unpatched vulnerability sitting in your production environment.
Test Coverage.
Below 40%, you’re deploying on faith. Below 20%, every change is a gamble.
Score your codebase 1–10:
9–10 (healthy, optimize only)
6–8 (targeted refactoring needed)
3–5 (significant modernization required)
1–2 (critical, modernize or replace)
Phase 2: Business Impact Assessment (Days 31–60)
Phase 1 told you how bad the technical problem is. Phase 2 answers the question your CFO actually cares about: What is this costing us in real dollars?
Developer Onboarding Cost.
Calculate months-to-productivity multiplied by fully loaded monthly cost. At $15K/month fully loaded and a 6-month ramp, that’s $90K per hire. Legacy systems routinely push onboarding to 6–12 months, compared to 1–3 months on modern stacks. The gap is money you’re spending to stand still.
Incident Response Cost.
Count production incidents over the last 12 months. Multiply by engineering hours spent, customer impact, and revenue lost during downtime. This number is usually larger than anyone expects.
Feature Velocity Decline.
Compare features shipped per quarter over the past two years. If velocity drops while headcount holds steady, the gap between those two lines is your technical debt tax.
Integration Maintenance.
How many hours per month does your team spend nursing CRM, payment, and partner API integrations? At 20 hours/month, that’s 240 hours/year of engineering capacity burned on plumbing.
Security Exposure.
Map vulnerabilities in your dependency tree against breach probability. The IBM Cost of a Data Breach Report 2025 puts the global average breach cost at $4.44 million and the US average at $10.22 million. Even a 5% annual probability makes this a material line item.
Compile these into a Business Impact Matrix and present them as “annual cost of maintaining the current system.” That framing matters. “Technical debt” sounds like an engineering complaint. “Annual cost of the status quo” sounds like a line item the CFO can act on.
Phase 3: Modernization Readiness Scoring (Days 61–90)
You know how bad it is and what it costs. Now: can your organization actually execute? Score each factor on a 1–5 scale:
Team Skill Readiness.
1 = significant hiring or upskilling needed. 5 = the team has modernization experience and can hit the ground running.
Vendor/Platform Lock-In.
1 = extracting requires 80%+ rewrite. 5 = reasonably portable architecture.
Data Migration Complexity.
1 = 15+ years of data in a monolithic database with undocumented schemas. 5 = well-structured, documented, and migration-ready.
Compliance Constraints.
1 = HIPAA, SOC 2, or PCI-DSS requirements significantly limit architecture options. 5 = strong compliance posture that transfers to a modern stack. For regulated industries, compliance is a design constraint from day one, not an afterthought. OLSYS builds compliance-by-design into every modernization engagement.
Organizational Appetite.
This is the factor engineers underestimate most. 1 = leadership views modernization as a vanity project. 5 = there’s an active executive sponsor with budget authority.
Sum scores (5–25):
18–25 (ready to execute)
13–17 (address gaps, then proceed)
5–12 (stabilize first, reassess in 6 months)
What Inaction Actually Costs
Deferring modernization feels like saving money. The data says otherwise.
According to Gartner research, 60–80% of IT budgets in large organizations go toward maintaining existing systems.
Here’s a formula you can fill in with your own numbers:
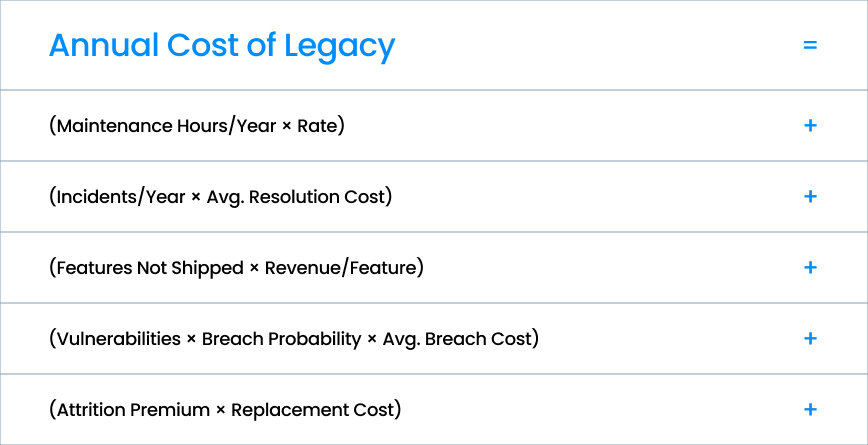
That last term, attrition, is the one most CTOs miss. Engineers maintaining legacy systems leave for modern stacks.
Replacing a senior developer costs 1.5–2x annual salary, and their replacement faces the same 6–12 month ramp on a system that’s now one person’s worth of institutional knowledge lighter.
3 Board-Ready Talking Points
Translate your assessment into language that non-technical decision-makers act on:
Cost: “Our current system costs us $[X] per year in maintenance, lost productivity, and security exposure. That’s a financial problem, not a technology problem.”
Return: “Modernization reduces that annual cost by 40–60% over [timeframe], with breakeven at 12–18 months.”
Risk: “We are [X months] from [compliance deadline / framework end-of-life / key-person departure]. After that point, our options narrow and costs go up.”
What Comes After the Assessment
If your codebase scored 1–3 and readiness is 13+, you’re positioned to act. The strategy depends on your situation: re-platform, re-architect, full rewrite, or a strangler fig pattern that replaces components incrementally while keeping production stable.
If readiness is below 13, invest in stabilization first. Improve test coverage. Write the documentation that doesn’t exist. Reduce incident frequency. Then reassess in six months with better data.
These scoring rubrics apply equally to legacy application modernization challenges involving PowerBuilder, COBOL, or aging ERP platforms. Only the Phase 1 technical details change.
When to Bring in a Legacy Modernization Partner
Most assessment frameworks work better with an external perspective. Internal teams carry assumptions about their own codebase, and organizational politics can distort how readiness is scored.
A partner who has run this process across dozens of codebases brings calibration: they know what a “4” actually looks like on vendor lock-in, and they’ve seen what happens when organizational appetite is a 2 but leadership says it’s a 4.
OLSYS has partnered with CTOs and VPs of Engineering at mid-market companies and well-funded startups to run exactly this kind of assessment. We’ve modernized legacy platforms in FinTech, Insurance, Healthcare, and Banking, where compliance constraints make the readiness scoring especially important.
Start the Assessment
You don’t need to decide today whether to modernize. You need to assess.
Talk to someone who’s done this.
Olsys offers a 30-minute strategy call to walk through your codebase, business context, and readiness factors. No pitch. Just an honest conversation about where you stand. Book a call.